We’re diving into the fascinating world of real numbers and exploring how to plot and compare them using line plots. Whether you’re a math enthusiast, a student looking to sharpen your skills, or just someone curious about the beauty of numbers, this guide will provide you with a clear understanding of how to visualize and compare real numbers effectively.

What Are Real Numbers?
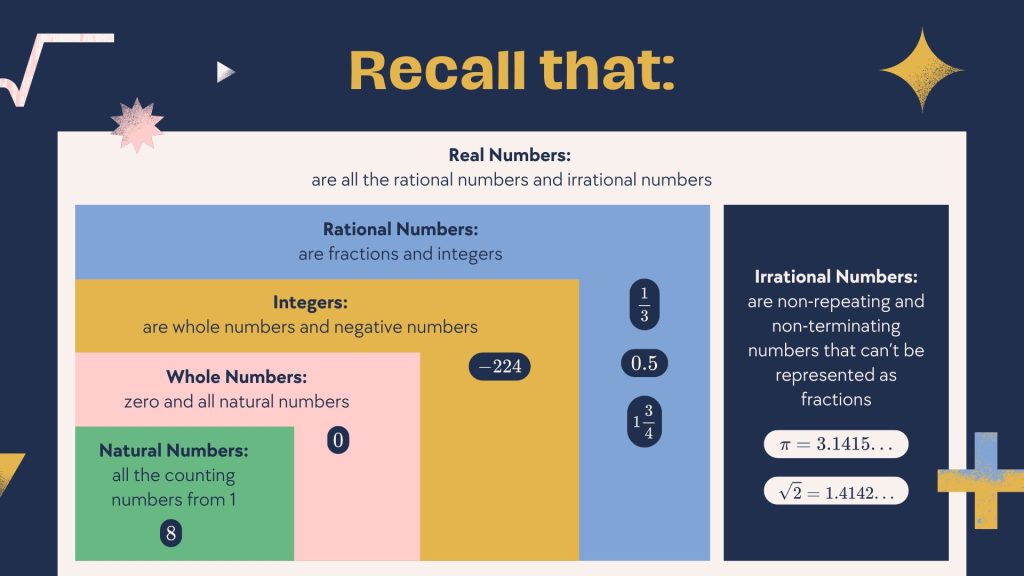
Real numbers encompass all the numbers that can be found on the number line. This includes:
Natural Numbers: 1, 2, 3, …
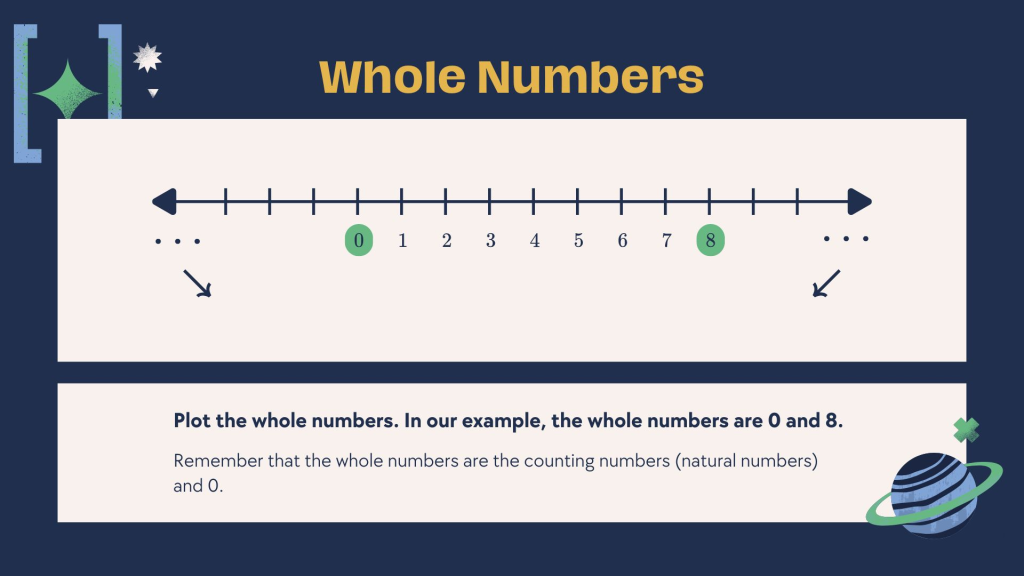
Whole Numbers: 0, 1, 2, 3, …
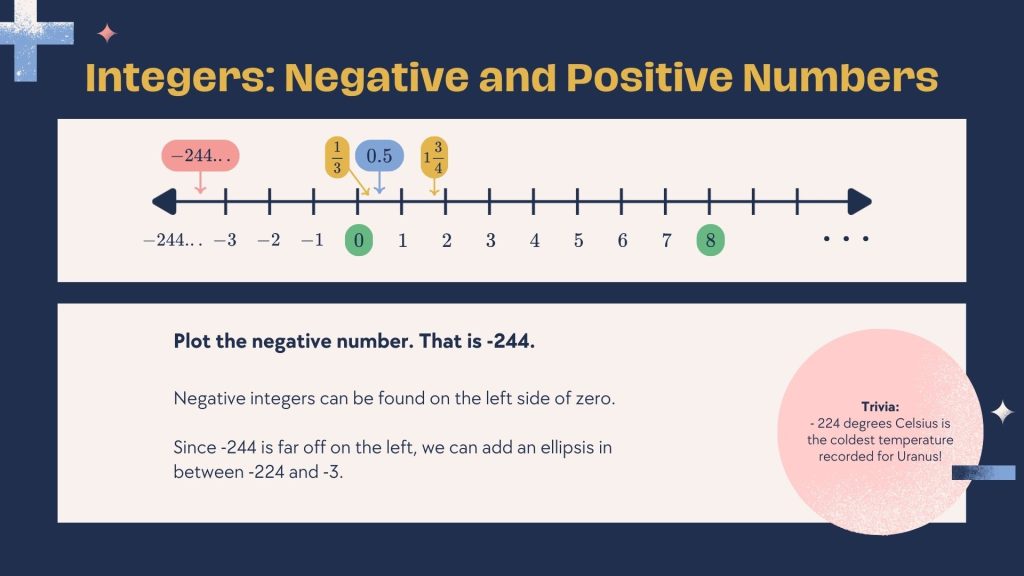
Integers: -3, -2, -1, 0, 1, 2, 3, …
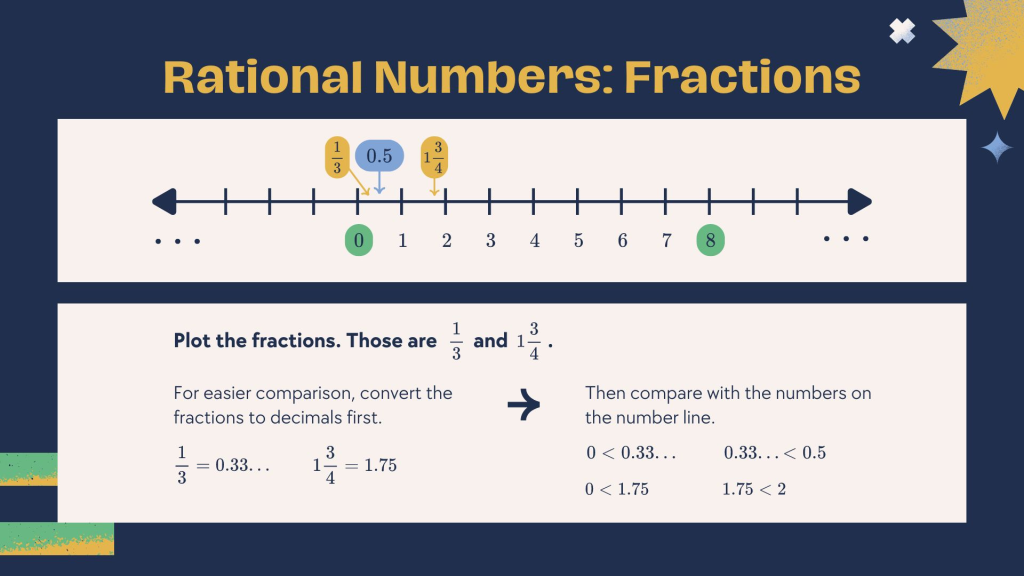
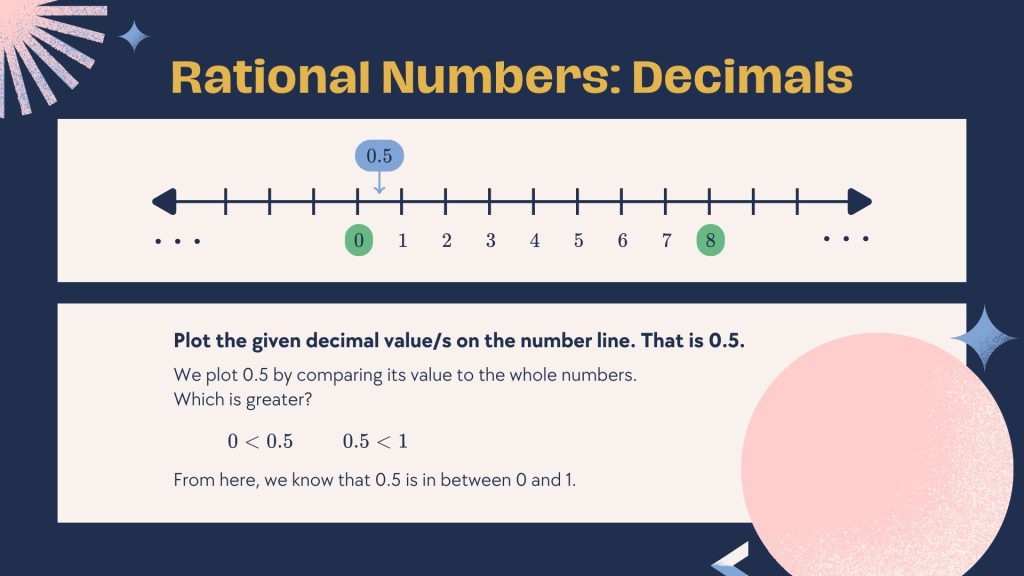
Rational Numbers: Numbers that can be expressed as fractions P/Q. P and Q are integers and Q≠0. For example 0.5, 1/3.
Irrational Numbers: Numbers that cannot be expressed as simple fractions. For example, π.
How to Create a Line Plot
Line plots are a simple yet powerful tool for visualizing real numbers. They allow us to see the distribution of data points along a number line and make it easy to compare values at a glance.
Creating a line plot involves a few straightforward steps:
- Draw a Number Line: Start by drawing a horizontal line and marking it with evenly spaced intervals. Label these intervals with appropriate values based on your data set.
- Plot the Data Points: For each real number in your data set, place a dot above its corresponding value on the number line.
- Analyze the Plot: Once all data points are plotted, you can begin to analyze the distribution and compare values.

Plotting and Comparing Real Numbers
We will learn to compare the following real numbers:
- Whole numbers
- Integers
- Rational numbers
Practice Makes Perfect
Let’s say we have the following set of real numbers: 2.5, -1.4, 3.8, 0.0, -2.7.
- Draw the Number Line:
-3    -2    -1     0     1     2     3     4
|-----|-----|-----|-----|-----|-----|-----|- Plot the Data Points:
-3    -2    -1     0     1     2     3     4
|-----|-----|-----|-----|-----|-----|-----|
        *           *           *        *
      (-2.7)      (-1.4)      (2.5)    (3.8)
                  *
                 (0.0)
With our line plot complete, we can now easily compare these real numbers:
- The smallest value is -2.7.
- The largest value is 3.8.
- We can see that 0 lies between -1.4 and 2.5.
Tips for Effective Line Plots
To make your line plots even more effective:
- Use Consistent Intervals: Ensure that intervals on your number line are evenly spaced for accurate representation.
- Label Clearly: Clearly label your number line and data points for easy interpretation.
- Color Coding: Use different colors or symbols if you’re comparing multiple sets of data on the same plot.
Learning about line plots helps you become better at understanding and comparing numbers. Whether you’re solving math problems or looking at data in science class, knowing how to use line plots will make things much easier and more fun! So next time you have some numbers to compare, try making a line plot! It’s a simple way to turn numbers into an easy-to-understand picture.


