Let’s meet at the skating rink in Kallang for a math sports faceoff! This is Spark Math by Spark Education‘s Math in Sports series featuring ice hockey! Did you know that the Singapore team has taken part in the International Ice Hockey Federation (IIHF) World Championship Division III under Group B? This year, the team had gone up against teams from Kyrgyzstan, Malaysia, Hong Kong, and more in a clash of exciting matches. The Math in Sports series is our way of helping parents tie math to their children’s favourite sports hobbies. With that said, let’s gear up for a Math Power Play with “Math in Sports: Ice Hockey and Math for Kids!”
Quick Hockey Overview
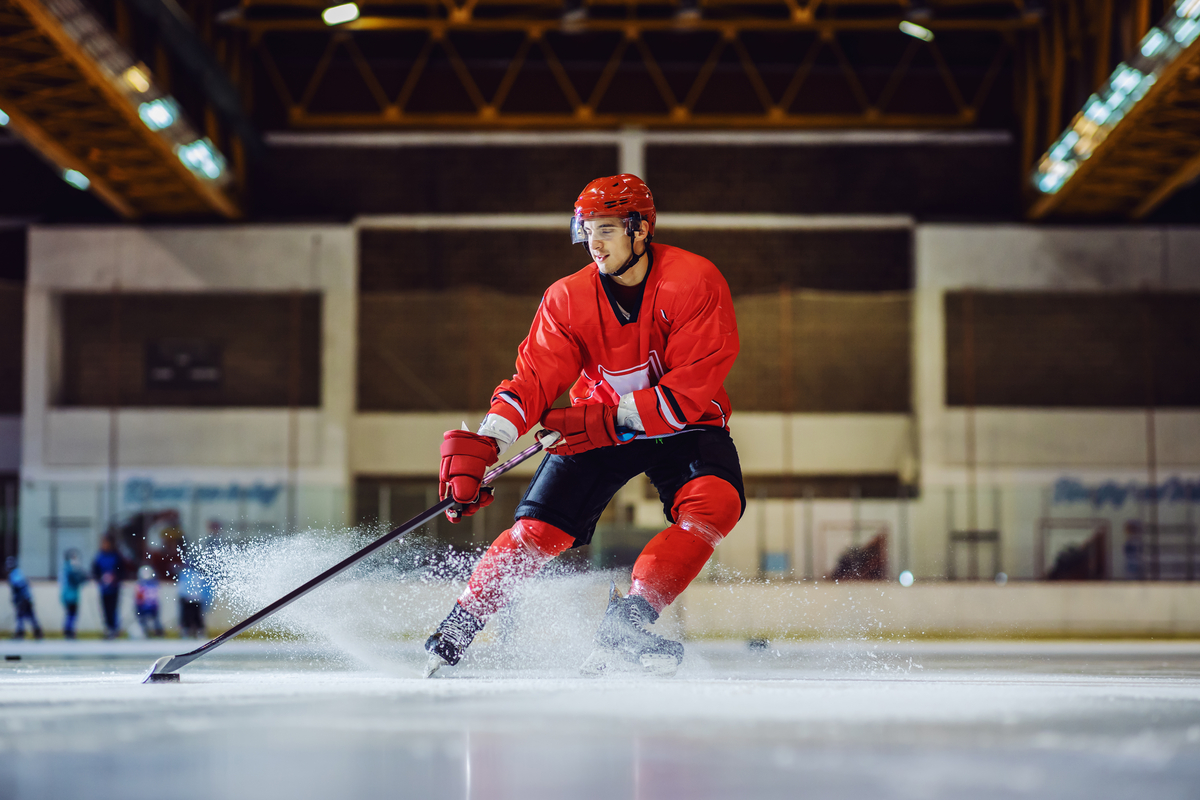
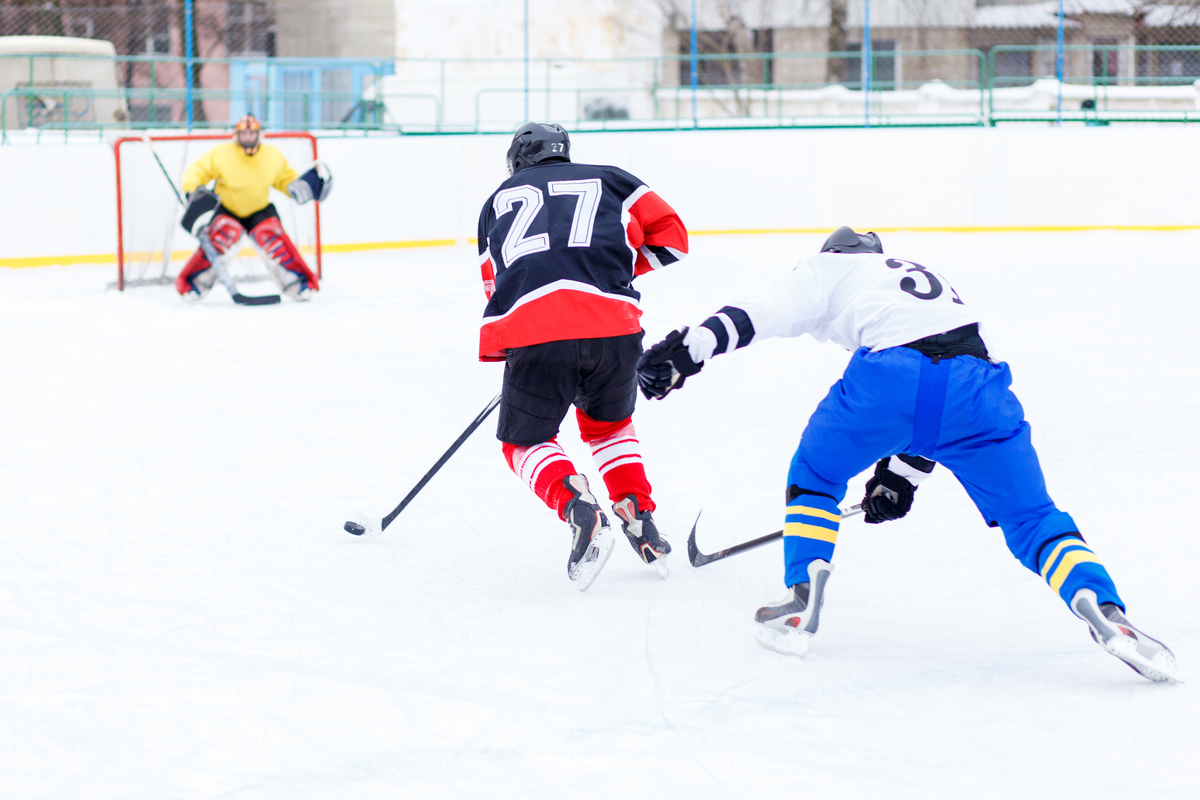
Ice hockey is a fast-paced contest between two opposing teams of 6 players each. Games are conducted in ice rinks, with players sporting pads, helmets, gloves, ice skates, and hockey sticks. Teams fight to control a small black object called the puck with the goal of scoring it in the other team’s goal. Each team has a goaltender that has a larger hockey stick and specialised glove to stop the puck from going in his net. Hockey is a highly physical sport that requires strong teamwork and lightning fast reflexes. A slapshot from a professional hockey player is about 161kph (100mph). Now that you know the basics, let’s skate into the math!
Offensive Hockey Math
In hockey, offensive stats usually revolve around goals, assists, points, and shots.
Goal: A shot by the offensive player resulting in a score
Assist: Passing the puck to another player who then scores
Points: This stat combines goals and assists
Shots: The number of shots at the goal by player

Shots on Goal and Shooting Percentage
Shots on goal are crucial to winning a game. Simply, if players aren’t getting chances to score, their team can’t win. Just as important is how many of those shots on goal are actually going in. This is where we see shooting percentage. Today, we will look at the shots on goal and shooting percentage of two ice hockey players for IIHF World Championship Division III 2023 Group B: Sultan Ismanov of HC Dordoi and Ethan Redden of Panthers.
Ismanov led the league in shots on goal, while Redden led in shooting percentage.
What Math You Will Need
- Addition
- Division
- Multiplication
For Shots on Goal we would follow these steps. Use Addition to add together the number of shots on goal taken each game to get the season total.
Ismanov took 29 shots on goal and Redden took 20 shots on goal in the 2023 tournament.
To calculate Shooting Percentage, we use Division and Multiplication. We divide the number of goals made by shots on goal and then multiply the answer by 100 to reach a percentage
Ismanov: 5 goals/29 shots on goal= 0.1724 x 100= 17.24% Shooting Percentage
Redden: 8 goals/20 shots on goal= 0.4000 x 100= 40.00% Shooting Percentage
From this information, we can see Redden is a more efficient scorer while Ismanov has more time with the puck but may be taking lower quality shots. With his excellent skills, Redden is also selected to be the best player of the Singapore team by the coach!
Points
Points looks at both goals and assists. This stat can reveal a lot about a player. A player with a lot of assists by a low point total might suggest he isn’t a great scorer, while a player with a high point total is a big contributor to the offense.
To calculate points you will need Addition.
Let’s take a look at the points scored by Mamed Seifulov of HC Kyrgyz Temir Johly, playing for Kyrgyzstan,in the Division III 2023 tournament. We need his number of goals (18) and assists (10).
18 Goals + 10 Assists = 28 points.
Skilled Seifulov was the top scorer of the tournament with 28 points!
Defensive and Goaltending Hockey Math
While the offense might be glory hogs, champions are forged by defenders and goaltenders too. Here are some key concepts it would be helpful to know.
Takeaways: When a defensive player steals the puck away from an opposing offender
Blocked Shot: When a defensive player stops a shot on goal
Save: When a goalie stops a shot on goal

Takeways Per Game
This is a quick way to see how aggressive a defense is and their success at taking possession of the puck. It also spreads the data across multiple games in the form of an average to help even out outliers in the data.
For this we need
- Addition
- Division
Let’s take a look at the Montreal Canadians team from Montreal. In the 2022-2023 National Hockey League season, they had the best defense in terms of takeaways.
First, we will add the takeways over 82 games to get 511 total takeaways
We divide 511 takeaways/82 games and we get 6.24 takeways/game.
Penalty Kill Percentage
In ice hockey, players can be taken off the ice as a result of a penalty. That gives the other team a 1 player advantage for a short time, this is called a Power Play. Penalty Kill Percentage refers to a team’s ability to prevent a goal from being scored while the other team has a power play.
For this we will need:
- Addition
- Division
- Multiplcation
We need to add together the number of penalities resulting in a power play a team received and compare it to how many goals were scored during those power plays.
In the Division III Group B 2023 tournament, Kyrgyzstan was the best team when it came to Penalty Kill Percentage.
The number of times the Kyrgyzstan team was shorthanded was 13. They held strong on 12 of those penalties.
12 stops/13 = 0.9230 x 100 = 92.30% Penalty Kill Percentage. The Kyrgyzstan team stormed ahead in the tournament to clinch the gold medal!
Goalies: Save Percentage and Goals Against Average
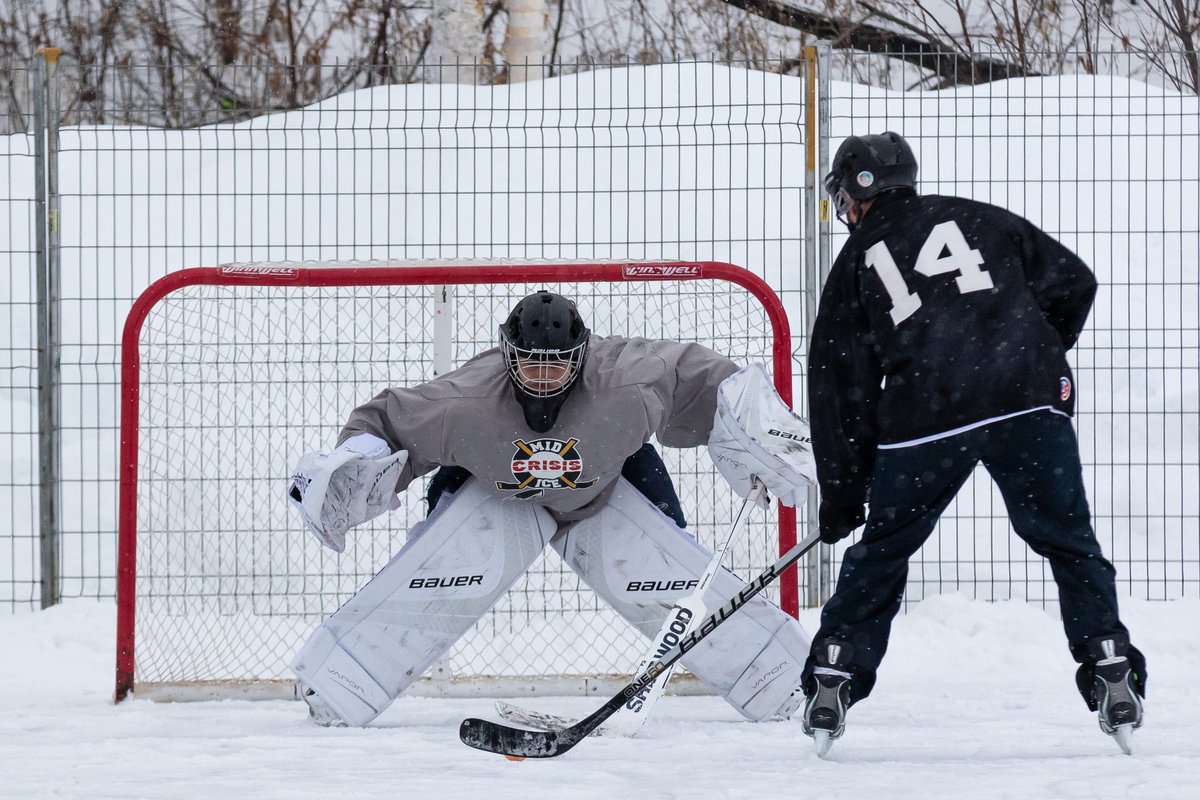
The goaltender is the last line of defense and is tasked with stopping 160 kph slapshots with his trusty glove and stick. A successful goalie has a strong save percentage and goals against stat line. Save Percentage measures out of how many shots on target the goal saves. Goals Against Average is a simple measure of how many shots a team lets in a game. A low Goals Against Average stat is a sign of a skilled goaltender that allowed few goals in a game.

Save Percentage
You will need:
- Addition
- Division
- Mulitplication
First we will use addition to add up the total number of shots on a goal and saves by a goal. For this, let’s look at Dino Pasovic, playing for the Bosnia and Herzegovina team.
Pasovic made 152 saves out of 171 shot attempts.
152 saves/171 shot attempts=0.8888 x 100 = 88.88% save percentage
Goals Against Average
You will need:
- Addition
- Division
Alexander Petrov showed he was a total powerhouse between the pipes last year with an excellent Goals Against Average.
Goals Against Average=(Number of goals recorded ÷ number of minutes played by the goalie) x Game length
Petrov’s Goals Against Average=(5 ÷ 175) x 60=1.71
Petrov is one of the two only goalies with a Goals Against Average of less than 2 in the tournament.
Final Thoughts
Ice hockey is a blast to watch and becoming more popular in recent years. If you have a hockey fan in the family, try getting them working on their favourite player’s stats using some of this math. If you are looking for more math fun that can keep your child engaged and learning, check out Spark Math. Book a free trial class today for the most fun and effective way to math success!
Love sports and math? See our other Math in Sports blogs here.


